7 November 2023
Digital editions contain extensive and complex data sets. Visualising these can help open them to new forms of interpretation by improving our understanding of the contexts in which they were created and providing new tools for exploring historical texts. The form the visualisation takes is determined not only by the editors’ epistemological interests and presentation preferences but also by what is actually possible with an edition’s existing data corpus. Although at the technical level of annotation, editorial standards are becoming increasingly homogeneous, editorial projects deploy different methods of constituting and annotating text and designing the critical apparatus. What surviving textual evidence is used to constitute an edited text? How extensively has a text been annotated? Which units of text are included in an apparatus register?
All these editorial decisions have an influence on what data can be visualised. Visualisations can draw on different types of data and metadata: data that describes the properties of the text object itself, e.g. language, author or year of publication (bibliographical metadata); data that shows the structural elements of a text such as page numbers, chapters or the cover (structural data/metadata); and standardised data records that help unequivocally identify entities such as persons, places and organisations (authority control data).
The current data corpus of the hybrid edition of the German works of Martin Opitz has two foundations. On the one hand, the retro-digitised edition texts of the ‘old volumes’ that were edited by George Schulz-Behrend between 1968 and 1990 and published by Hiersemann Verlag. These follow the chronological ‘first-hand’ editing principle, i.e. they are based on first editions. Then there are the ‘new volumes’ that are being compiled by Professor Jörg Robert’s team at Universität Tübingen (University of Tübingen) and will also be published in stages by Hiersemann Verlag. These are based on the old volumes but observe current editorial standards and emphasise in-depth cataloguing of the content on a broader scale and more thorough annotation of the works. The two will be combined in the hybrid edition’s digital portal, which is currently being created at the Herzog August Bibliothek and will go online in the coming months. The volumes will be published in stages on the online portal with a Moving Wall delay of two years.
Opitz’s works exist primarily as prints and less frequently as manuscripts. Given their state of preservation and the editing principles used, little would be gleaned from creating elaborate interactive visualisations of their origins using metadata and structural data. However, since the Opitz hybrid edition annotates authority control data on persons and places in great detail, it makes sense to focus on this.

Spatial humanities methods in digital editions
Despite his importance today for German literary history and poetic theory, Opitz was by no means a full-time poet. He worked as a privy councillor, secretary and historiographer in various courts and travelled extensively with a diplomatic remit on their behalf. However, visualising his spheres of influence is revealing in more than just biographical terms. A large proportion of the edited texts comprises casual verse written for weddings, funeral services or eulogies for people in power. Networks of individuals and cartographical visualisations can help to better understand the contexts in which his works were composed against the fraught background of the Thirty Years’ War. Particularly in his last decade, ‘the Polish years’, Opitz negotiated these different cultural spaces with great sensitivity and at times served four princes simultaneously – with their knowledge and consent.
In this creative phase he also wrote works of regional geography such as Sarmatica and the lost Dacia antiqua. Although neither of them was included in the new edited volumes, they reflect an interest shared by Opitz and his employers in incorporating the geographical knowledge of the time into the texts. In the Late Renaissance, writings on regional geography, like maps, were instruments of cultural spatial practice – i.e. material and symbolic tools used by a culture to inscribe its norms, values and meanings in physical space and provide it with an organisational structure. They speak of the desire to locate specific territories in an ever-expanding world. From today’s point of view, visualisations of historical areas such as Silesia and Transylvania should therefore be implemented with care.
The ‘spatial humanities’ deal with questions of how to incorporate spatial data into research. Numerous digital tools for comparing historical and contemporary geodata have been developed in this context. The map views in the Opitz hybrid edition utilise such tools. For example, apps like geojson.io, QGIS, DARIAH-DE Geo-Browser and leaflet were used to geotag historical places and areas onto modern map views, transform historical map digitalisations into current georeference systems and programme new interactive maps. This has produced maps that allow users to select their own viewing levels and apply filters for edited volumes, persons or time horizons in order to find visualisation views relevant to their research questions.

Yet a cursory glance at the edition reveals that not every location can just be added onto a contemporary map. In addition to places that clearly correlate with real-world locations, Opitz’s poetry also contains forgotten, invented and mythical locations. Visualisations of such spatial configurations in the text can help us to explore early modern narration from new perspectives. What role does the narration of space from a European perspective play in this period? To what extent can historical or fictional locations stand for other places and events?
Conventional research methods often lead nowhere at first. Visualisations can help to identify and correct inconsistencies and gaps. They are therefore useful tools for improving data quality and expanding an edition’s database – and they ensure that a broad, interdisciplinary academic audience has access to complex information.
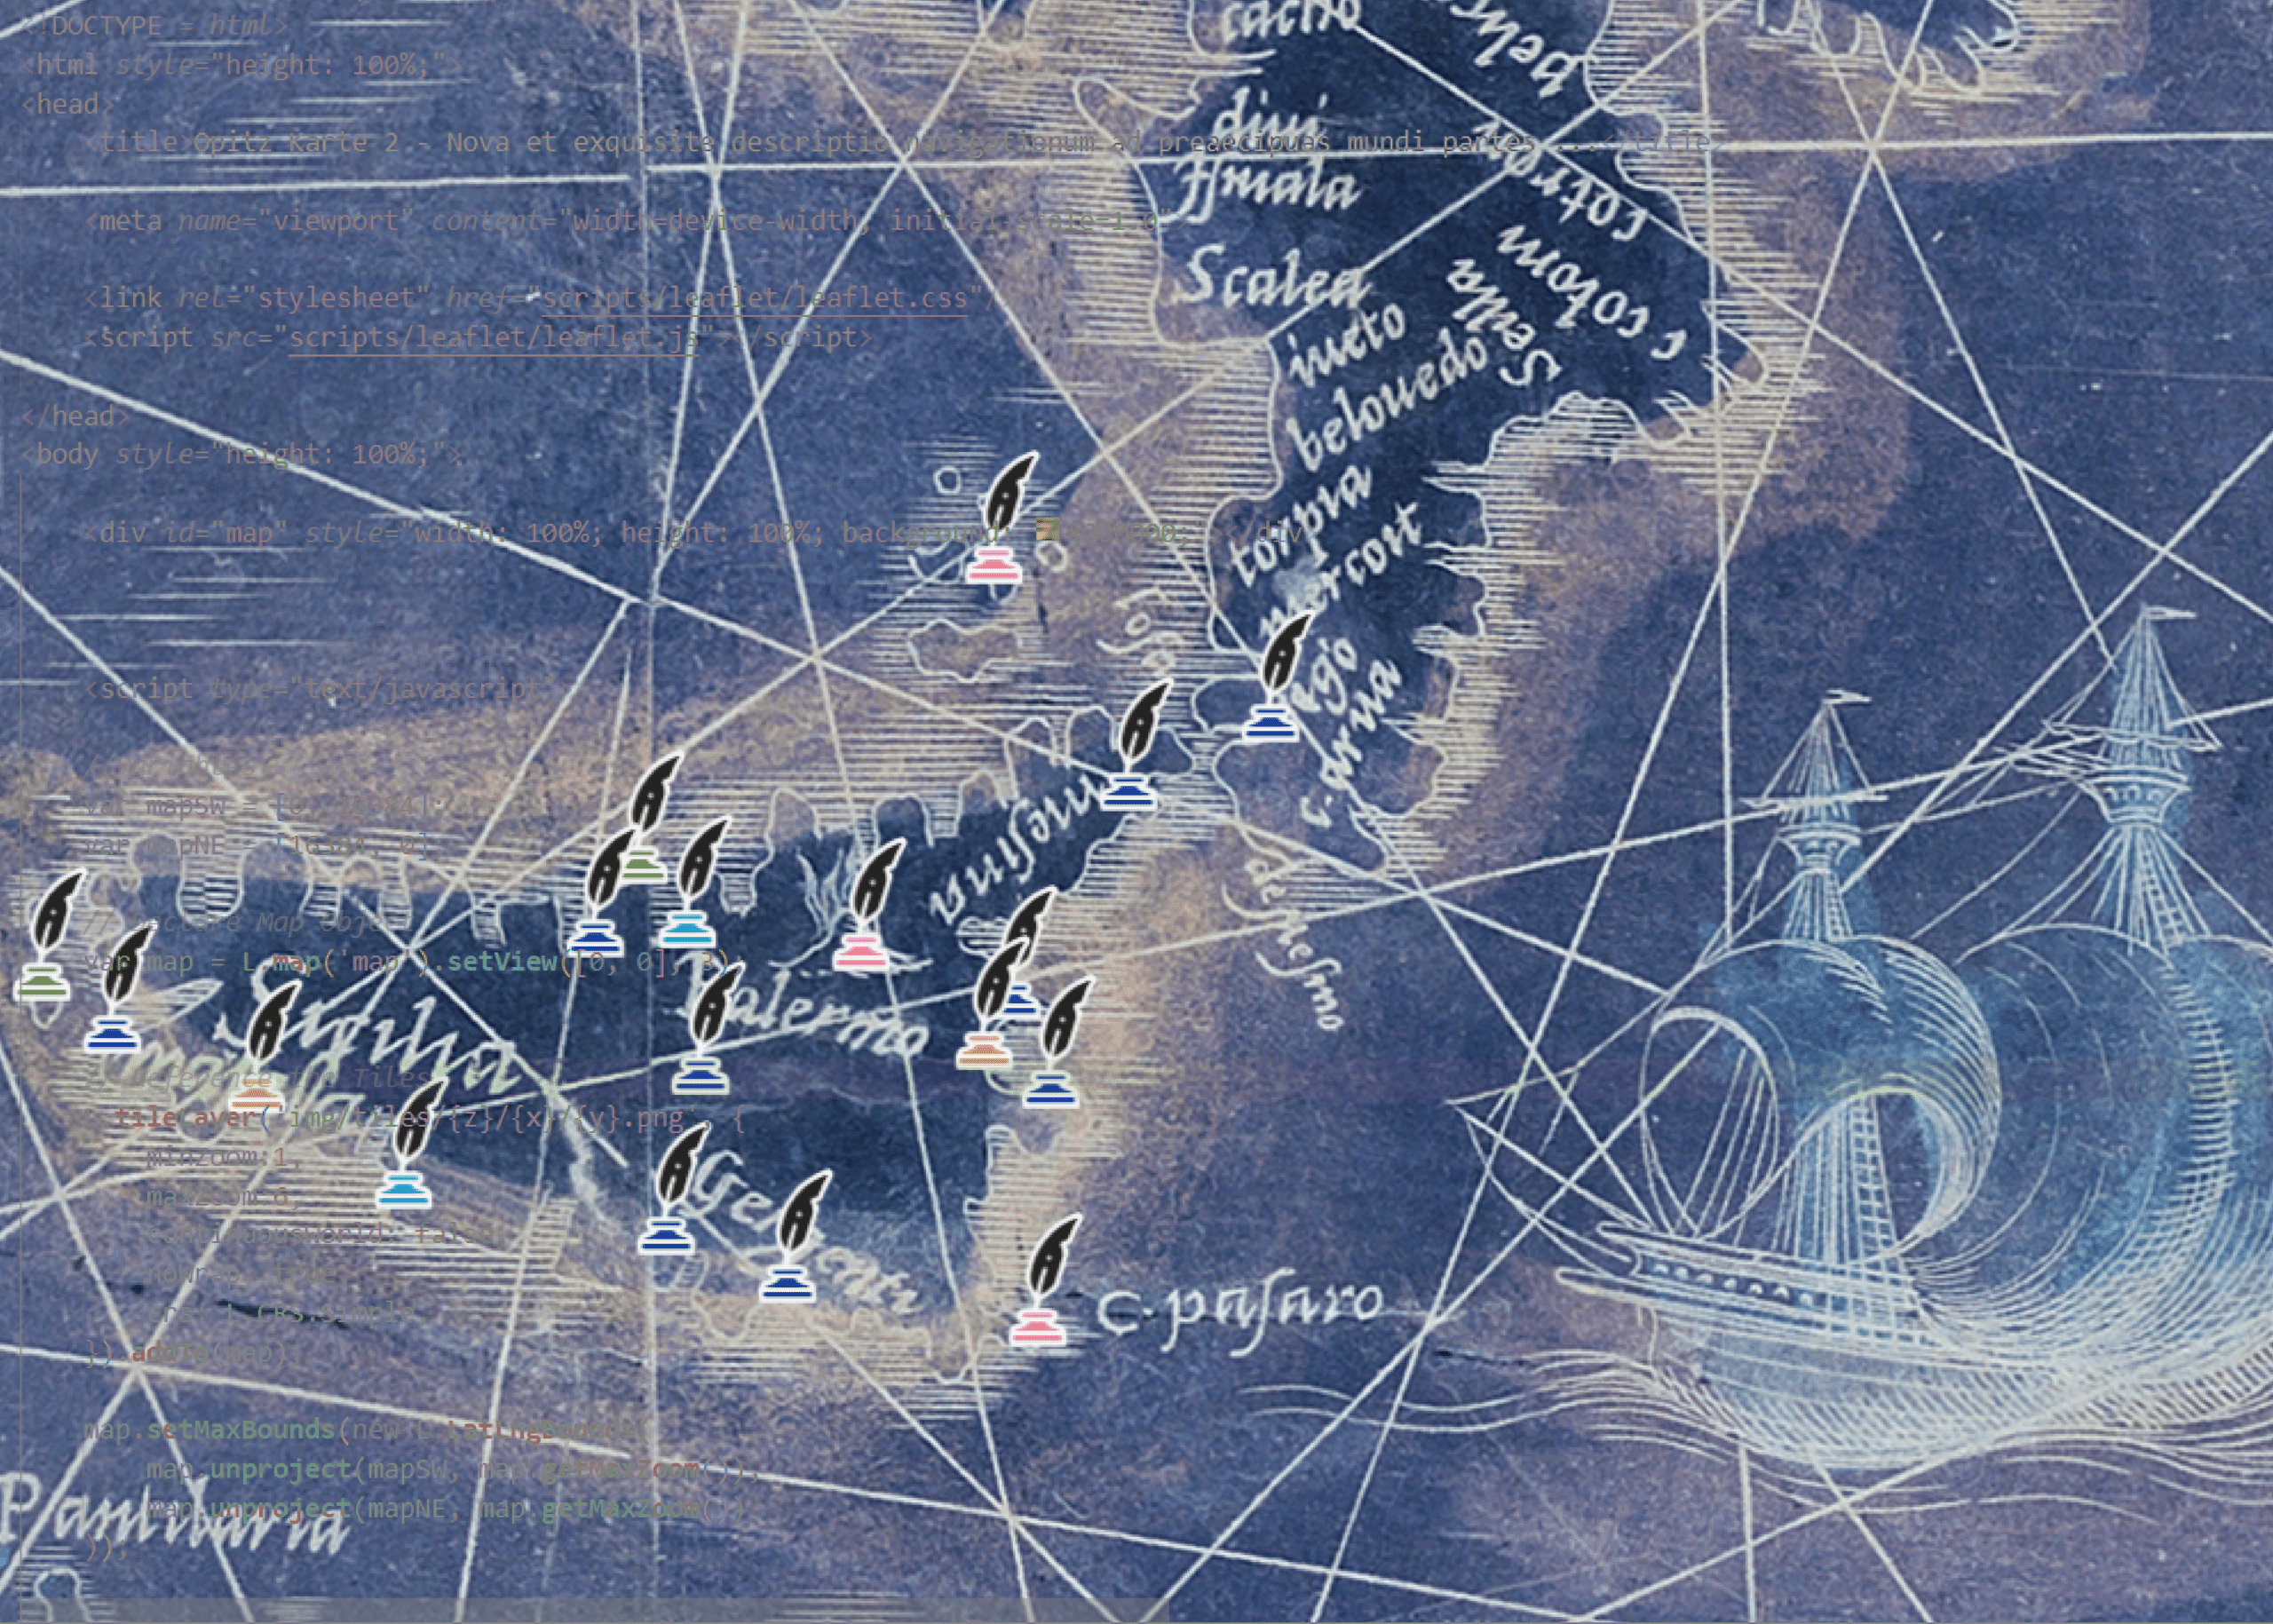
Cover image: Collage of a negative image and the code used for the leaflet visualisation of locations featured in Argenis, books 1–5, based on the portolan chart Nova et exquisita descriptio navigationum ad praecipuas Mundi partes by Nicolas de Nicolay, 1544, K 3.90. Screenshot: Schwaß, 2023.
PURL: diglib.hab.de?link=177
The author